24 HOUR WU ALLOCATION
| Research | Percent |
|---|---|
|
ALZHEIMERS |
64.17% |
|
ATGPA1 POST TRANSLATIONAL MODIFICATIONS |
35.83% |
7 DAY WU ALLOCATION
| Research | Percent |
|---|---|
|
ALZHEIMERS |
74.81% |
|
ATGPA1 POST TRANSLATIONAL MODIFICATIONS |
25.19% |
Current averages, ranks, sample depth, and data freshness.
| DATA SAMPLES INFO Filter applied, PPD samples all time |
AVERAGE FOLDING PERFORMANCE Based on ALL available PPD samples by filter |
WORK UNIT PPD RECORDS All Time |
|||||
|---|---|---|---|---|---|---|---|
| OS FILTER | SAMPLES | PPD | WU Per 24hrs | Time Per WU | Points Per WU | BEST PPD | WORST PPD |
| All OS AVG | 15,625 | 4,843,395 | 20.42 | 1 hrs 11 mins | 237,192 | 1,289,599,488 | 232,015 |
| Linux | 7,470 | 5,414,790 | 23.05 | 1 hrs 2 mins | 234,883 | 17,284,344 | 519,617 |
| Windows | 8,155 | 4,319,996 | 18.05 | 1 hrs 20 mins | 239,307 | 1,289,599,488 | 232,015 |
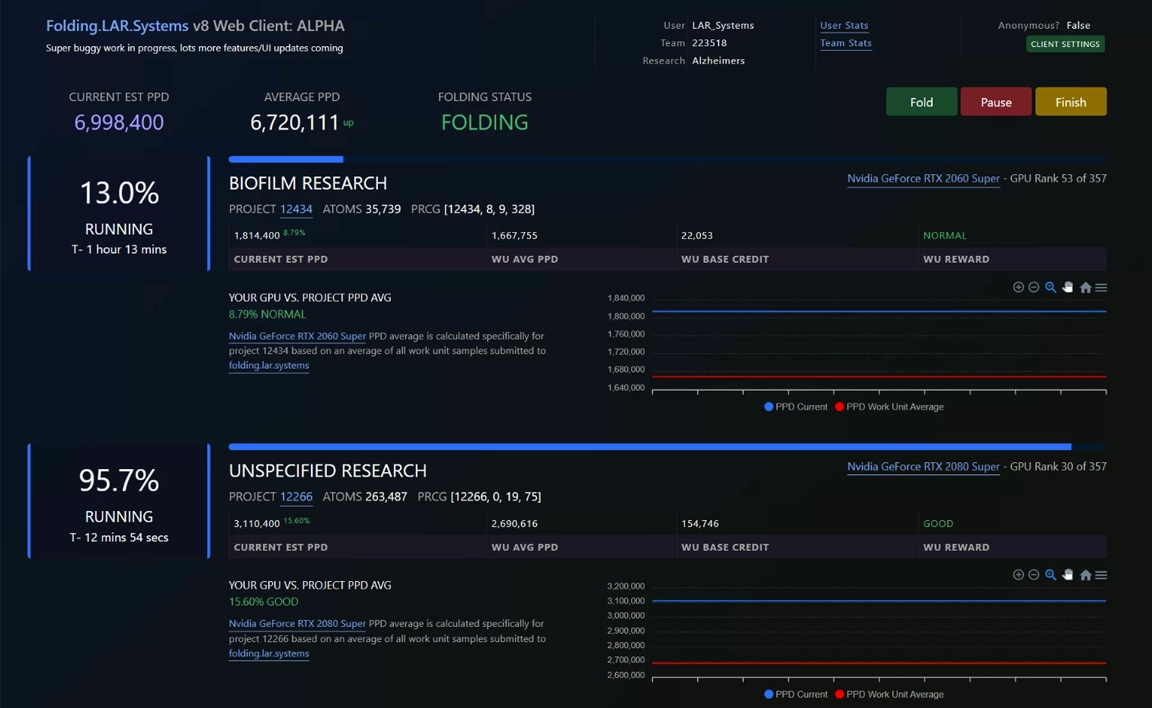
Launch the LAR.SYSTEMS V8 Web Client to monitor live work-unit activity, compare your machine with community benchmarks, and contribute real samples that keep public rankings and hardware insights current for the Folding@Home community.
| Sample | Folder | Team | Platform | Seen |
|---|---|---|---|---|
| Most recent WU sample | andan | Default (No team specified) | Linux GPU | Today |
| First seen | fluxmaven | ExtremeHW | Windows GPU | 1 year ago |
Use the range, net change, and latest average as a quick signal—not a final judgment on the GPU.
Values use the same weekly community averages as the detailed chart.
GPU PPD average changes week to week for a number of reasons such as credit for type of projects/causes available, variance in work unit difficulty, OS/GPU drivers, folding cores, GPU models, clocks, power targets etc.
The chart below serves as a way to see historical week to week performance change as PPD for a GPU is never a constant, as the work units processed are always changing.
Average PPD is impacted by the types of research work units being done as they return different amounts of points and take different amounts of time.
The following shows the work unit allocation of research causes to better understand changes in PPD over time for the GeForce RTX 5060 Ti.
| Research | Percent |
|---|---|
|
ALZHEIMERS |
64.17% |
|
ATGPA1 POST TRANSLATIONAL MODIFICATIONS |
35.83% |
| Research | Percent |
|---|---|
|
ALZHEIMERS |
74.81% |
|
ATGPA1 POST TRANSLATIONAL MODIFICATIONS |
25.19% |
The following visualization illustrates the PPD / Credit allocation of work units across different research causes, providing insight into how PPD varies by work unit PPD samples for the GeForce RTX 5060 Ti.
This analysis helps better understand the relationship between research causes and PPD/Credit, highlighting any performance trends as clusters or anomalies as outliers.
| PPD Rank | Project ID | Cause Research | PPD Average | Points WU Average | WUs Day Average | WU Time Average |
|---|---|---|---|---|---|---|
| 1 | 15337 | rca-stability-temperature-simulations | 22,715,692 | 532,000 | 42.70 | 0 hrs 34 mins |
| 2 | 12132 | Reflectin-Peptide-Conformation | 9,144,369 | 154,065 | 59.35 | 0 hrs 24 mins |
| 3 | 18227 | cancer | 8,841,135 | 101,000 | 87.54 | 0 hrs 16 mins |
| 4 | 15218 | cancer | 8,560,250 | 150,000 | 57.07 | 0 hrs 25 mins |
| 5 | 15302 | cancer | 8,543,876 | 70,857 | 120.58 | 0 hrs 12 mins |
| PPD Rank | Project ID | Cause Research | PPD Average | Points WU Average | WUs Day Average | WU Time Average |
|---|---|---|---|---|---|---|
| 1 | 19020 | parkinsons | 1,734,504 | 56,018 | 30.96 | 0 hrs 47 mins |
| 2 | 12707 | cannabinoid | 2,035,724 | 51,500 | 39.53 | 0 hrs 36 mins |
| 3 | 13014 | nipah-virus-decoy-protein-design | 2,133,791 | 157,584 | 13.54 | 1 hrs 46 mins |
| 4 | 15326 | rca-thermal-stability-simulations | 2,258,040 | 651,000 | 3.47 | 6 hrs 55 mins |
| 5 | 15332 | rca-oligomeric-stability-temperature-simulations | 2,282,829 | 527,000 | 4.33 | 5 hrs 32 mins |