Radeon RX 9060(XT)
FOLDING@HOME PPD PERFORMANCE
Performance snapshot
Current averages, ranks, sample depth, and data freshness.
- All-OS average
- 2,413,117
- Average PPD from submitted samples
- Linux average
- 2,886,365
- Linux-only samples
- Windows average
- 2,410,246
- Windows-only samples
- Work unit samples
- 1,161
- All-time profile volume
- Overall rank
- #103
- 441 GPUs tracked
- Brand rank
- #16
- 133 AMD GPUs
Folding Statistics Navi 44 [Radeon RX 9060(XT)] - AMD
| DATA SAMPLES INFO Filter applied, PPD samples all time |
AVERAGE FOLDING PERFORMANCE Based on ALL available PPD samples by filter |
WORK UNIT PPD RECORDS All Time |
|||||
|---|---|---|---|---|---|---|---|
| OS FILTER | SAMPLES | PPD | WU Per 24hrs | Time Per WU | Points Per WU | BEST PPD | WORST PPD |
| All OS AVG | 1,161 | 2,413,117 | 14.72 | 1 hrs 38 mins | 163,896 | 3,692,895 | 609,650 |
| Linux | 7 | 2,886,365 | 54.46 | 0 hrs 26 mins | 53,000 | 2,915,206 | 2,805,231 |
| Windows | 1,154 | 2,410,246 | 14.65 | 1 hrs 38 mins | 164,568 | 3,692,895 | 609,650 |
Profile your Radeon RX 9060(XT) in our V8 Web Client
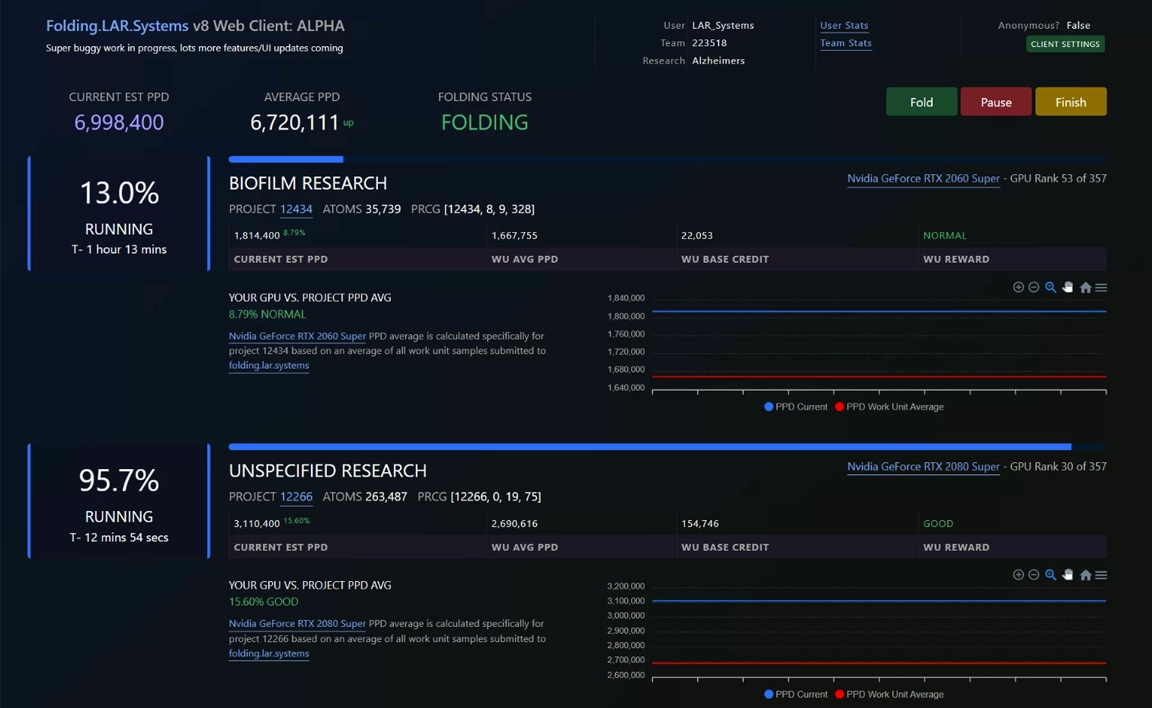
Launch the LAR.SYSTEMS V8 Web Client to monitor live work-unit activity, compare your machine with community benchmarks, and contribute real samples that keep public rankings and hardware insights current for the Folding@Home community.
| Sample | Folder | Team | Platform | Seen |
|---|---|---|---|---|
| Most recent WU sample | casuta | Team Romania | Windows GPU | 3 months ago |
| First seen | casuta | Team Romania | Windows GPU | Not recorded |
12-week performance at a glance
Use the range, net change, and latest average as a quick signal—not a final judgment on the GPU.
How to read this
- Weekly movement can reflect project mix, available work units, drivers, or operating systems rather than a lasting hardware change.
- Use the detailed chart to compare operating systems and work-unit availability across the full period.
- Latest weekly average
- Not enough data
Recent Work Unit Performance - Radeon RX 9060(XT)
Average PPD is impacted by the types of research work units being done as they return different amounts of points and take different amounts of time.
The following shows the work unit allocation of research causes to better understand changes in PPD over time for the Radeon RX 9060(XT).
Data is provided in legacy mode until new work units are folded using our web client.
Recent Work Unit Performance Clusters - Radeon RX 9060(XT)
The following visualization illustrates the PPD / Credit allocation of work units across different research causes, providing insight into how PPD varies by work unit PPD samples for the Radeon RX 9060(XT).
This analysis helps better understand the relationship between research causes and PPD/Credit, highlighting any performance trends as clusters or anomalies as outliers.
Highest sampled PPD
| PPD Rank | Project ID | Cause Research | PPD Average | Points WU Average | WUs Day Average | WU Time Average |
|---|---|---|---|---|---|---|
| 1 | 15404 | cancer | 3,132,698 | 71,706 | 43.69 | 0 hrs 33 mins |
| 2 | 15402 | cancer | 3,087,001 | 204,469 | 15.10 | 1 hrs 35 mins |
| 3 | 12708 | cannabinoid | 2,977,055 | 365,482 | 8.15 | 2 hrs 57 mins |
| 4 | 18242 | Force-Field-Protein-Simulation | 2,915,965 | 187,425 | 15.56 | 1 hrs 33 mins |
| 5 | 15302 | cancer | 2,891,398 | 70,857 | 40.81 | 0 hrs 35 mins |
Lowest sampled PPD
| PPD Rank | Project ID | Cause Research | PPD Average | Points WU Average | WUs Day Average | WU Time Average |
|---|---|---|---|---|---|---|
| 1 | 18260 | alzheimers | 809,717 | 189,665 | 4.27 | 5 hrs 37 mins |
| 2 | 15000 | membrane transport | 937,735 | 215,000 | 4.36 | 5 hrs 30 mins |
| 3 | 12133 | Reflectin-Peptide-Conformation | 1,013,785 | 155,255 | 6.53 | 3 hrs 41 mins |
| 4 | 18257 | alzheimers | 1,210,704 | 206,552 | 5.86 | 4 hrs 6 mins |
| 5 | 19020 | parkinsons | 1,434,618 | 49,010 | 29.27 | 0 hrs 49 mins |