GPU section GPU tools and references

Radeon PRO W6400
FOLDING@HOME PPD PERFORMANCE

GPU profile

Performance snapshot

Current averages, ranks, sample depth, and data freshness.

Folding@Home identifier Navi 24 [Radeon PRO W6400]
High confidence
Most recent sample Sep 6, 2026 Most recent update seen for this GPU profile.
All-OS average
573,917
Average PPD from submitted samples
Linux average
304,142
Linux-only samples
Windows average
813,116
Windows-only samples
Work unit samples
6,775
All-time profile volume
Overall rank
#82
441 GPUs tracked
Brand rank
#12
133 AMD GPUs
Sampled performance breakdown

Folding Statistics Navi 24 [Radeon PRO W6400] - AMD

DATA SAMPLES INFO
Filter applied, PPD samples all time
AVERAGE FOLDING PERFORMANCE
Based on ALL available PPD samples by filter
WORK UNIT PPD RECORDS
All Time
OS FILTER SAMPLES PPD WU Per 24hrs Time Per WU Points Per WU BEST PPD WORST PPD
All OS AVG 6,775 573,917 2.69 8 hrs 55 mins 213,356 182,194,619 61,602
Linux 3,184 304,142 2.33 10 hrs 17 mins 130,319 3,546,372 114,233
Windows 3,591 813,116 2.83 8 hrs 28 mins 286,982 182,194,619 61,602
Track this hardware live

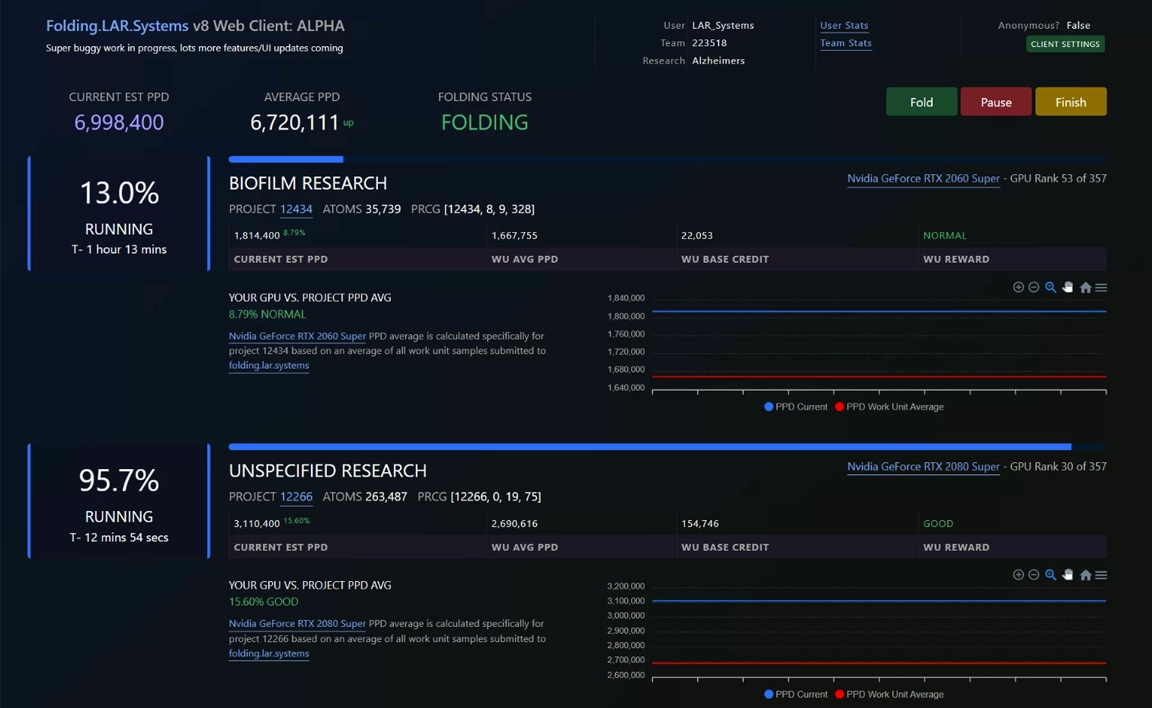
Profile your Radeon PRO W6400 in our V8 Web Client

Launch the LAR.SYSTEMS V8 Web Client to monitor live work-unit activity, compare your machine with community benchmarks, and contribute real samples that keep public rankings and hardware insights current for the Folding@Home community.

First and most recent work-unit sample contributors
Sample Folder Team Platform Seen
Most recent WU sample d69hw0irhkuy www.banano.cc Windows GPU 4 days ago
First seen d69hw0irhkuy www.banano.cc Windows GPU Not recorded
Recent GPU performance

12-week performance at a glance

Use the range, net change, and latest average as a quick signal—not a final judgment on the GPU.

View detailed chart
How to read this

Values use the same weekly community averages as the detailed chart.

  • Weekly movement can reflect project mix, available work units, drivers, or operating systems rather than a lasting hardware change.
  • Use the detailed chart to compare operating systems and work-unit availability across the full period.
12-week range
420,823 to 3,929,704 PPD
Net change over 12 weeks
-2,404,968 PPDTrend down
Latest weekly average
420,823 PPD

12 WEEK AVG PPD CHANGE VS. WORK UNITS AVAILABLE - Radeon PRO W6400

GPU PPD average changes week to week for a number of reasons such as credit for type of projects/causes available, variance in work unit difficulty, OS/GPU drivers, folding cores, GPU models, clocks, power targets etc.

The chart below serves as a way to see historical week to week performance change as PPD for a GPU is never a constant, as the work units processed are always changing.

Weekly PPD history chart.

Recent Work Unit Performance - Radeon PRO W6400

Average PPD is impacted by the types of research work units being done as they return different amounts of points and take different amounts of time.

The following shows the work unit allocation of research causes to better understand changes in PPD over time for the Radeon PRO W6400.

24 HOUR WU ALLOCATION

Research Percent
No Data For This Reporting Period.

7 DAY WU ALLOCATION

Recent Work Unit Performance Clusters - Radeon PRO W6400

The following visualization illustrates the PPD / Credit allocation of work units across different research causes, providing insight into how PPD varies by work unit PPD samples for the Radeon PRO W6400.

This analysis helps better understand the relationship between research causes and PPD/Credit, highlighting any performance trends as clusters or anomalies as outliers.

Project work-unit sample cluster chart.
Reading the averages

Why your PPD may differ

PPD is a guide, not a fixed result. Daily output changes with the work-unit mix, including project, points, atom count, and deadline, as well as system conditions such as OS, drivers, clocks, thermals, and power limits.

Compare the five highest and lowest sampled project averages for Radeon PRO W6400 using community samples collected through the LAR.SYSTEMS V8 Web Client.

Highest sampled PPD

PPD
Rank
Project
ID
Cause
Research
PPD
Average
Points WU
Average
WUs Day
Average
WU Time
Average
118264alzheimers3,405,115398,2578.552 hrs 48 mins
215239atgpa1-post-translational-modification-dynamics3,256,596642,8835.074 hrs 44 mins
315329rca-thermal-stability-simulations2,473,508594,0004.165 hrs 46 mins
415325rca-oligomer-stability-simulations2,194,985527,0004.175 hrs 46 mins
518260alzheimers1,243,83459,00021.081 hrs 8 mins

Lowest sampled PPD

PPD
Rank
Project
ID
Cause
Research
PPD
Average
Points WU
Average
WUs Day
Average
WU Time
Average
115221membrane transport217,429120,0001.8113 hrs 15 mins
212135Reflectin-Peptide-Conformation223,865420,8800.5345 hrs 7 mins
315410enzyme-dynamics224,90818,12312.411 hrs 56 mins
412134Reflectin-Peptide-Conformation231,120442,2250.5245 hrs 55 mins
512132Reflectin-Peptide-Conformation234,412154,0651.5215 hrs 46 mins